Alitzel Villanueva's Portfolio
Collection of Open Source GIS Work
Spatial Accessibility of Covid-19 Healthcare Resources
Reproduction of
Rapidly Measuring Spatial Accessibility of COVID-19 Healthcare Resources
Original study by Kang, JY., Michels, A., Lyu, F. et al. Rapidly measuring spatial accessibility of COVID-19 healthcare resources: a case study of Illinois, USA. Int J Health Geogr 19, 36 (2020). https://doi.org/10.1186/s12942-020-00229-x.
Reproduction Author: Alitzel Villanueva
Reproduction Materials Available at: RE-Kang
Created: 24 May 2021
Revised: 26 May 2021
Introduction
Kang et al (2020) was heavily influenced by the recent urgent need to know the spatial accessibility of healthcare resources as hundreds of thousands of people were hospitalized and died last year due to COVID-19. This study, focussed on Illinois, aimed to answer what kind of access people had to healthcare resources during the pandemic, which areas have sufficient and insufficient resources, and what role demographics play in accessibility. Kang et al measured spatial accessibility by calculating the time between homes of COVID-19 patients/vulnerable populations (people over 50 years) and health care resources creating a two-step floating catchment area using Jupyter Notebook to map the hospital and residential locations. Using an open source framework like CyberGIS-Jupyter allows others to amend the code used to create these service areas so that this spatially accessibility model can be applied to other regions of the world to address this issue of universal access that is prevalent as COVID-19 continue to persist.
Materials and Methods
This reproduction study of Kang et al. followed their original methodology almost completely with a couple of changes made to the code to improve its applicability to Illinois’ spatial accessibility. Kang et al used four different datasets to understand spatially accessibility of healthcare resources for the general population and COVID-19 patients in Illinois. The Illinois Department of Public Health (IDPH) provided the COVID-19 confirmed case and the hospital dataset, U.S. Census Bureau provided the residential dataset and the road network dataset was accessed through a Python package OSMnx to analyze street networks from OpenStreetMap Python Library. Kang et al excluded all hospitals that may not serve COVID-19 patients like military, children, psychiatric, and rehabilitation hospitals. They focussed on hospitals serving the Chicago population due to the significant clustering of COVID-19 cases in the city, including hospitals within 15 miles of the Chicago boundary. They were able to use the U.S. Census data to extract data from the population over the age 50 as their vulnerable population in addition to the population that tested positive for COVID-19. Using the conventional two-step floating catchment area (2SFCA) method, Kang et al located the vulnerable population in the catchment area of each hospital and then used that to find the ratio of ICU beds/ventilators to number of vulnerable people in each catchment area. These ratios were added together for residential locations where hospital catchment areas overlapped. These accessibility measurements were then aggregated into hexagon grids.
The first major change made to the code was done to fix the error caused by OSM nodes created for the hospitals near the edges of the Chicago boundary (within 15 miles). This error caused for some areas to account for more beds or ventilators than were actually available due to the nodes’ limitation of the OSM network that allowed for some hospitals to appear nearer than reality. We amended this by extending the road network by 30km so that the nodes would better represent hospital locations. I also added the code %%time to the beginning of each code block to investigate how time efficient the code was as well as change the color ramp of the final map from OrRd to RdPu so that darker reds no longer indicated more accessibility.
Results and Discussion
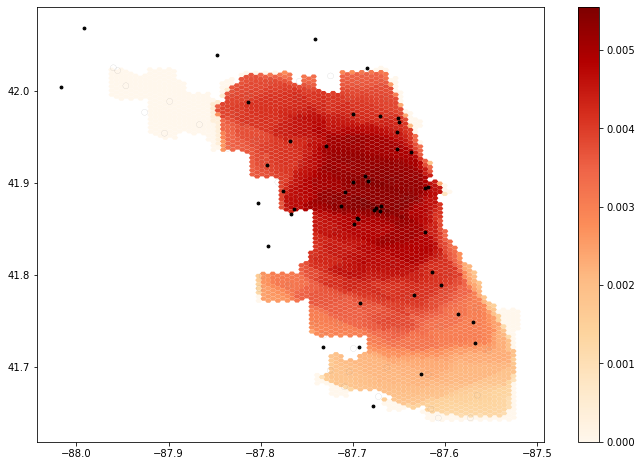
Original map
My reproduction map
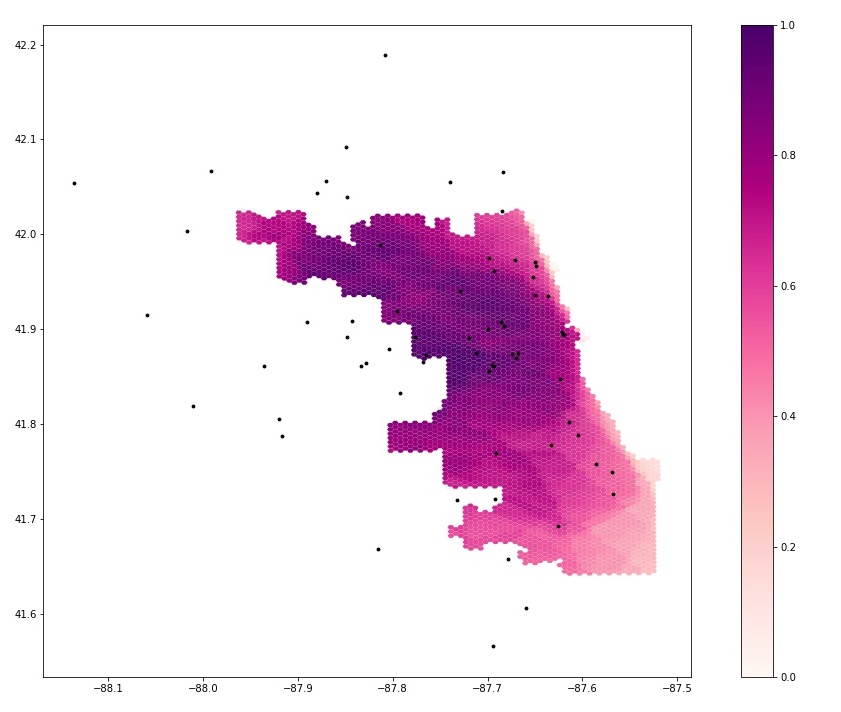
The most notable change from the original study to my reproduction was the change in the extent of the road network allowed for the my reproduction map of Kang et al’s final output map to include and better represent a more realistic accessibility index for the area between -87.95 and -87.85. On the original map there are no data for this area but in my reproduction it can be seen how accessible healthcare resources were for this residential area. There are also changes in which areas of Chicago have the most accessibility to healthcare resources and which areas do not have a lot of accessibility. This change is most apparent in the southern part of the map where the least accessible areas become moderately accessible near the 41.7,-87.6 areas. Similarly, there is an increase in accessibility as many of the areas that were red in the first map and now purple, as seen in the areas from 41.8 to 42.0.
Overall, despite some of the barriers to conduct a full replication, Kang et al. provided a solid framework to complete a functional reproduction of this analysis of the Chicago area. The CyberGIS-Jupyter framework facilitated a relative seamless reproduction, however due to the lack of code for some of the methods described in Kang et al. it would have been difficult to replicate this study with another dataset aside from the ones provided. There was little cleaning of the data in the Jupyter notebook, meaning the data was filtered and attributes that were studied were chosen prior to the start of the code. This was apparent in the vulnerable population data that was defined as populations over age 50 from U.S. Census data, however this concentration of vulnerable populations was not shown in the code, but simply provided for us to use. The same thing occurred with the hospital data that the paper outlined excluded hospital types that would not serve COVID-19 patients, however this data cleaning was not included in the code. To fully replicate this study, many of the steps included in the paper that were not included in the code must be added like the data cleaning steps done outside of the code in the Jupyter notebook.
Conclusions
Kang et al. addresses an important issue to our society that goes beyond the scope of the current COVID-19 pandemic and crisis created by the shortage of healthcare resources. Kang et al. has provided a reproducible study whose open source nature allows anyone access to this data and thereby the ability to use this code to answer further questions not only about healthcare resource access. Although there are still steps needed to be taken in order to produce a replicable study from Kang et al., this study provides a great foundation and contribution to the emerging field of open source science. Completing this reproduction of Kang et al. has given me hope for future studies that not only focus on issues of inequity but also incorporate ways to combat societal inequity through their methods.
Acknowledgments
Thank you to Maja Cannavo, Sanjana Roy, and the Open Source GIScience class for all of the collaborative work to modify the code.
References
Kang, JY., Michels, A., Lyu, F. et al. Rapidly measuring spatial accessibility of COVID-19 healthcare resources: a case study of Illinois, USA. Int J Health Geogr 19, 36 (2020). https://doi.org/10.1186/s12942-020-00229-x.
Luo, W., & Qi, Y. (2009). An enhanced two-step floating catchment area (E2SFCA) method for measuring spatial accessibility to primary care physicians. Health & place, 15(4), 1100-1107.