Alitzel Villanueva's Portfolio
Collection of Open Source GIS Work
Gravity Model Spatial Interaction
Deliverables:
Purpose of the models:
A gravity model is an incredibly useful tool that can address issues of accessibility and distance between two objects. In this case, we are looking at the accessibility of hospitals within Vermont to analyze the service area of different hospitals in different towns throughout the state. Using two different input point layers, we can examine which hospitals serve which geographic areas. This model is able to automate a multi-step process that can involve many errors along the way. Through this model, the process of analyzing spatial interaction can be reproduce exactly the same each time.
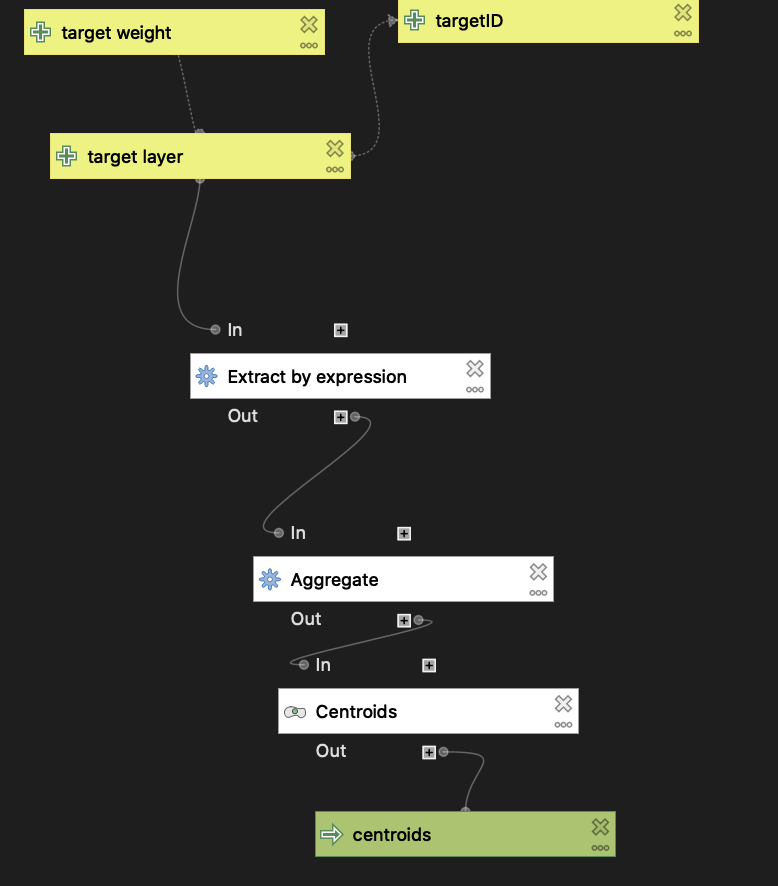
Hospital Data Preprocessing
Before the gravity model can be implemented, it is necessary to clean the data to ensure it can be used. This first model shows the preprocessing of one of the data set inputs used in the gravity model, hospitals. This model allows the data to cover the areas we are examining while also making sure we are looking at hospitals that serve the general population. To do this, I focussed on hospitals that were open and served women, children, or had general acute care. Additionally, I aggregated the hospital points by name and made that into centroids to simplify all of the initial data points given. This is process is depicted in a workflow below.
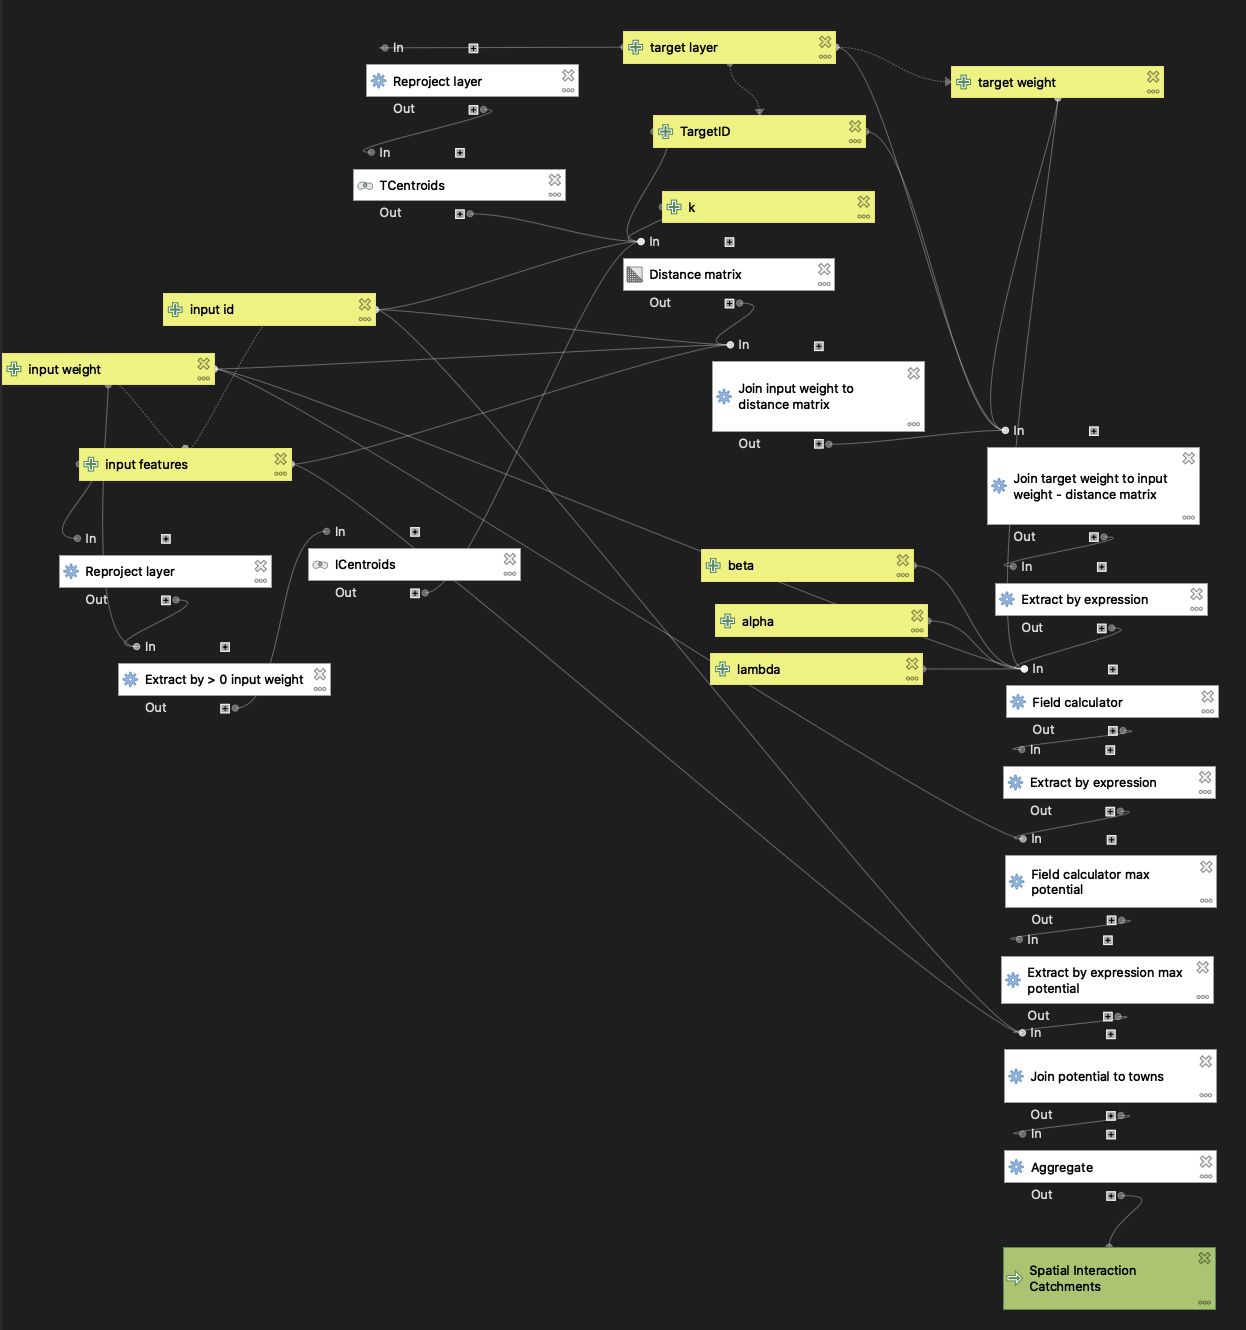
Gravity Model
To begin calculating hospital catchments in the New England area, I started by inputting an input polygon layer of townships in New England and a target layer of the preprocessed hospital centroids to find the gravity model’s version of hospital service areas in New England. Population and beds were the weight fields respectively for the towns and hospital layers used in the gravity model.
Interpretation of the models:
Overall, my gravity model of spatial interaction does not compare well to the actual Dartmouth Hospital Service Area as seen in the web map. I believe the issue lies in the fact that I located both layers by name and not ZIP code, which I think impacted the aggregation of data points. This is heavily seen all over my web map, but more specifically this difference in service areas calculated is evident nearer big cities like New York and Boston where my gravity model splits up the Dartmouth Hospital Service Areas into smaller portions.
Acknowledgments:
Thank you to the Spring 2021 GEOG 323 class for all of the collaborative work and to Prof. Holler for data and guidance.
Data sources:
- Hospital Data: Homeland Security
- Dartmouth Atlas of Health Care boundary files
- Town Data: American Community Survey 2018 5-year Average, complied by Prof. Holler.